24/7 Revenue Visibility with Automated Financial Dashboards
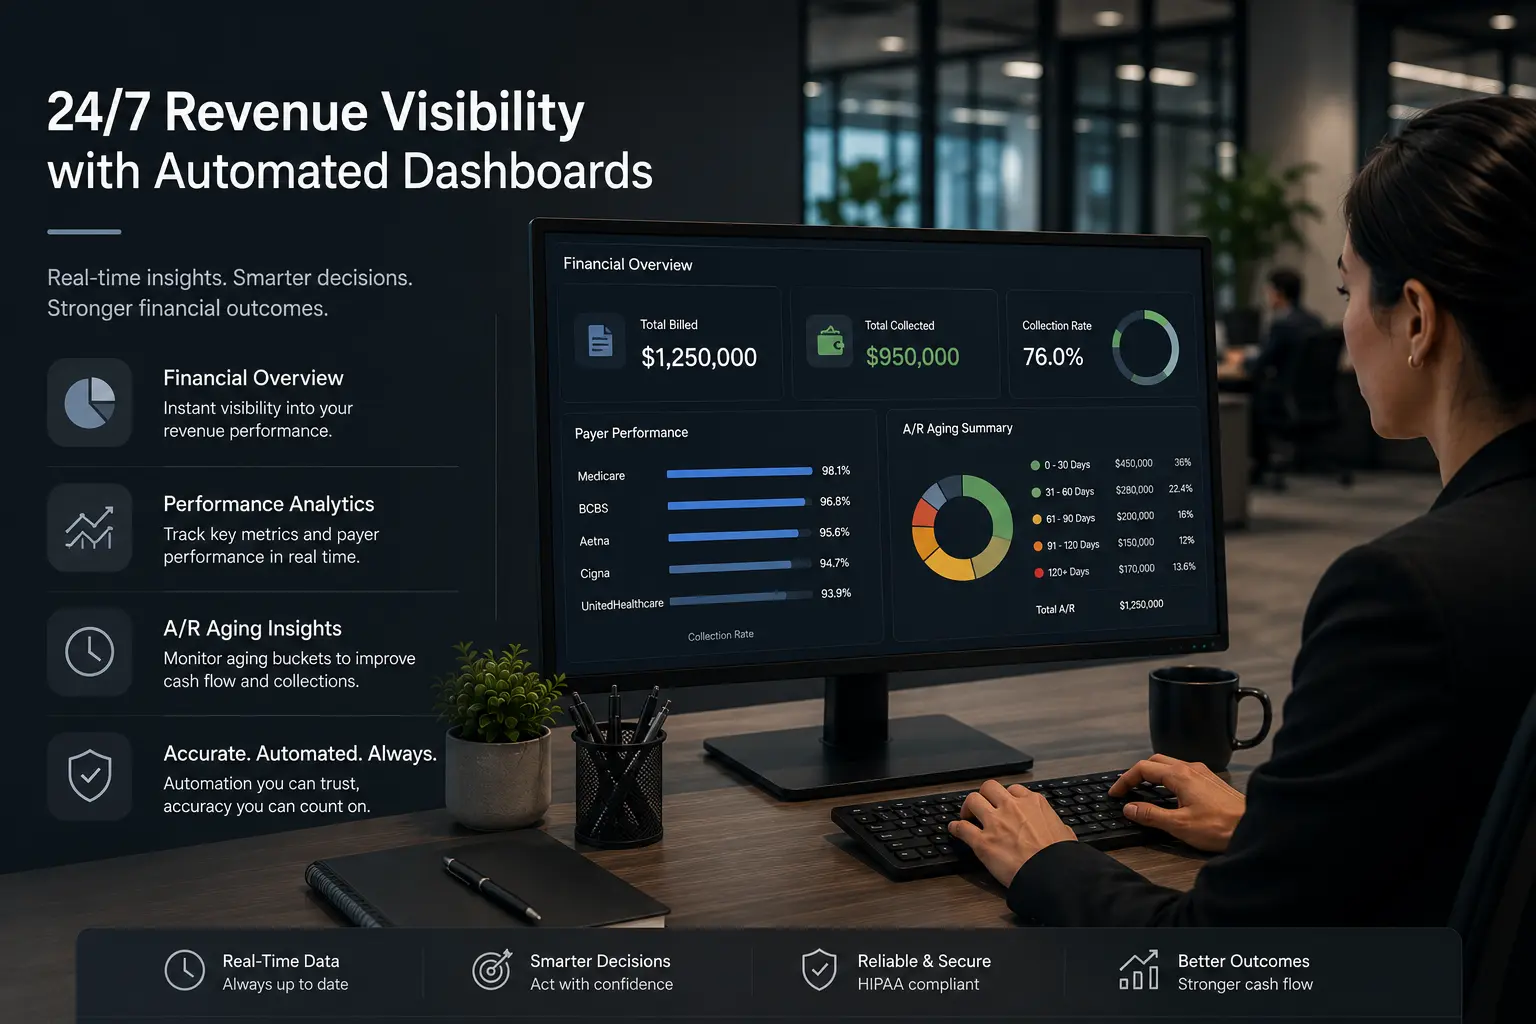
Keep your finger on the financial pulse of your practice. We eliminate tedious, multi step manual tracking by structuring our real time RCM dashboards around the core elements of financial statements. This automated, foundational approach ensures precise ledger accuracy and immediate revenue visibility. Monitor your exact financial position with live metrics, including:
- Total Billed vs. Total Collected
- Clean Claim Rate (Targeting 96.2%+)
- Payer Performance Metrics (Medicare, BCBS, Aetna, Cigna, UnitedHealthcare)
- A/R Aging Buckets (0-30 days up to 120+ days)
Frequently Asked Questions
What financial metrics are tracked in SwyftRevenue dashboards?
+
−
We track core revenue Key Performance Indicators (KPIs), including Net Collection Rate (NCR), Days in A/R (DAR), First-Pass Clean Claim Rate, Clean vs. Denied Claim Ratios, Payer Mix breakdowns, and Provider Productivity.
How often will my practice receive financial reports?
+
−
Practice managers get 24/7 access to live financial dashboards along with automated monthly executive summaries and quarterly strategy reviews with a dedicated RCM account manager.
What is Net Collection Rate, and why does it matter more than gross collections?
+
−
Net Collection Rate measures what you actually collect against what you were contractually entitled to collect — not against your full billed charge. It's the single most accurate measure of revenue cycle health, because it accounts for contractual write-offs that gross collections numbers hide.
Can I see reporting broken out by individual payer?
+
−
Yes — Payer Mix and Payer Performance Metrics are tracked separately for Medicare, BCBS, Aetna, Cigna, UnitedHealthcare, and your other contracted payers, so you can see which plans are slow, which deny most, and which reimburse below contract.
What's included in the automated monthly executive summary?
+
−
A condensed view of your Net Collection Rate, Days in A/R, First-Pass Clean Claim Rate, and Clean vs. Denied Claim Ratios for the month, delivered without you having to build the report yourself from the live dashboard.
What happens in the quarterly strategy review?
+
−
A working session with your dedicated RCM account manager to review trends across the quarter — denial patterns, payer performance shifts, A/R aging direction — and adjust your billing workflow if a recurring issue has emerged.
Can I track Provider Productivity if I have more than one provider in the practice?
+
−
Yes, reporting breaks out by individual provider where your practice has multiple clinicians, showing collections, denial rate, and coding patterns per provider rather than only at the practice level.
Does the dashboard show historical trends, or only current numbers?
+
−
Both — current live metrics plus historical trending across prior months and quarters, so you can see whether your Net Collection Rate and Days in A/R are improving, flat, or declining rather than viewing a single snapshot.
Who has access to the dashboard — just me, or my whole staff?
+
−
Access can be extended to whoever on your team needs it — a practice manager, an office administrator — with the same real-time visibility you have, so financial oversight isn't bottlenecked through one person.
Is the reporting dashboard included, or a paid add-on?
+
−
Included under your standard monthly fee or collections percentage — the dashboard, monthly executive summaries, and quarterly strategy reviews carry no separate charge.